
The Data on Hit and Runs in San Diego: Not An Epidemic, but Still Worrisome
Last summer, Mario Koran at the Voice of San Diego wrote an incredibly sobering series on the impact of hit and run crashes in the region. At around the same time, those of us that meet as part of the Livable Streets Coalition began discussing this issue by committing to implement Vision Zero in San Diego: the goal of having zero road fatalities within the next ten years.
Thanks to the hard work of Kathleen Ferrier at Circulate San Diego, the coalition to support implementing Vision Zero in the city of San Diego has grown and now it is up to our elected officials to ensure that San Diego becomes the third city in the U.S. to commit to Vision Zero.
While Koran detailed the depressing reality behind hit and run crashes in San Diego, we wanted to understand what the San Diego Police Department was doing to address the issue. Were these crashes truly an epidemic, as Koran claimed? Was anything being done to address this horrific reality?
I initiated a meeting with the SDPD to talk about this and other public safety issues as it related to bicycling and asked Lieutenant Andrew Hoffman who works in the traffic division to share some hard data.
Hoffman shared his department’s data analysis and the one thing that jumped out was that last year’s hit and runs were far less than the average over the past 13 years. According to the SDPD:
The average number of hit and run crashes per year over the past thirteen years was 5,029.
While last year, the number was slated to hit 3,684, a reduction of almost 27%.
Still a lot of hit and runs, but not quite an epidemic in that the numbers were going down.
Hoffman, in an email (sent last summer) continued,
On average over the past eight years we have had 20 fatal hit and run collisions. We have had eight this year, putting us on track for just under 13. That represents a 35% reduction from the eight year average. Again, a few high profile cases have given the impression there has been an increase when there has not.
He went on to write:
Pedestrian Collisions with Injury or Death:
In 2013 we had 291 collisions involving injuries to pedestrians. 67 of those involved serious injury and of those, 21 resulted in death.
So far in 2014 we have had 153 such collisions, 32 resulting in serious injury and of those 15 resulted in a death.
We are on track this year for 244 such collisions (a 16% reduction), 51 collisions involving injury (a 17% reduction), and 15 deaths (a 28% reduction).Bicycle Collisions with Injury or Death:
In 2013 we had 33 collisions involving injuries to bicyclists. 21 of those involved serious injury and of those, 4 resulted in death.
So far in 2014 we have had 18 such collisions, 10 resulting in serious injury and of those none resulted in a death.
We are on track this year for 28 such collisions (a 15% reduction), 15 collisions involving injury (a 28% reduction), and 0 deaths (a 400% reduction).
Finally, we are one of the most prolific DUI enforcement departments in the State. We have grant funded DUI checkpoints and or saturation patrols virtually every single weekend. Our performance in this area consistently yields results significantly more substantial than other agencies throughout the State and is responsible for SDPD being awarded the largest State grant in the region.
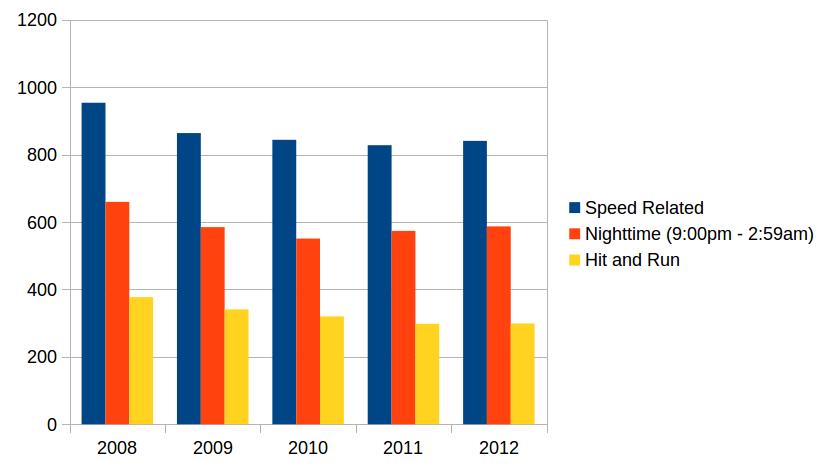
The downward trend is reflected in the state’s Office of Traffic Safety database as well.
Still, one death or serious injury is one too many. What specifically could be done to address the reality that people are getting away, sometimes without consequences for their actions? Mark Vallianatos, from Los Angeles Walks had some suggestions, which I’ve edited to be within the San Diego context:
- Publicize the crisis of deaths from motorized vehicle crashes and set targets and strategies to address the problem.
- Design roads for safety rather than for speed. The best way to reduce speeding, unsafe driving, and resulting crashes and deaths is to design and transform streets so that drivers are constrained and influenced by the physical layout of the road to move at a safe speed. Narrower lanes and traffic calming measures cause drivers slow down more effectively than posted speed limits on a wide, straight street engineered to remove all obstacles for fast motor traffic.
- Invest in pedestrian (and bicycle) infrastructure and programs proportionate to the need.
- Lower speed limits to protect pedestrians, especially children. Pedestrians hit by a car travelling 20 m.p.h. have just a 5 percent chance of being killed. The fatality rate skyrockets to 85 percent when a car is travelling 40 m.p.h. Many cities around the world are setting speed limits near schools and in residential and other highly walked areas at 20 m.p.h./30 k.p.h.
Highlighting the hit and runs was certainly useful in making the broader public aware of the issue. Ensuring that these crashes are publicized through all public safety channels and that the parties involved in the tragedy face the consequences of their actions could certainly help to deter the truly egregious tragedies.